


Prometheus.io monitoring system and time series database client in Erlang.
- IRC: #erlang on Freenode;
- Slack: #prometheus channel - Browser or App(slack://elixir-lang.slack.com/messages/prometheus).
Integrations
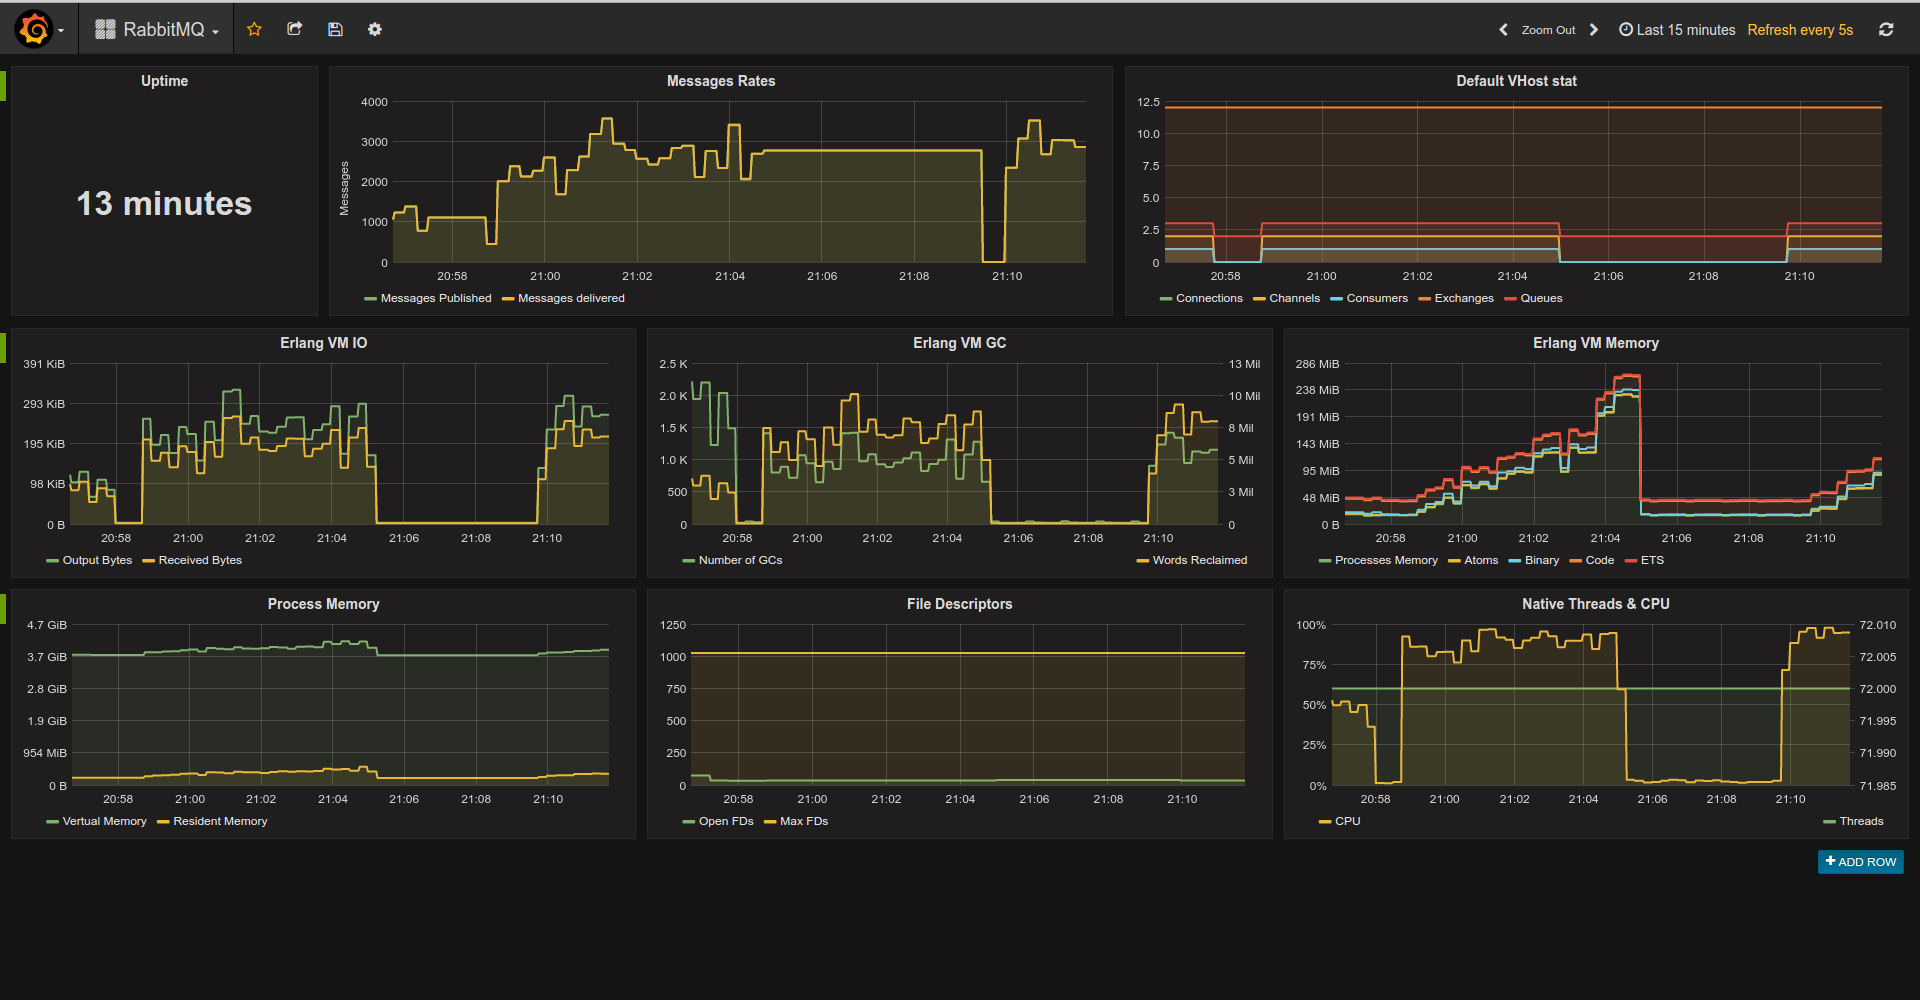
Dashboards
Blogs
Erlang VM & OTP Collectors
Compatibility
OTP versions
Version 3.x works on OTP18+. For older version (oldest tested is R16B03) please use
3.x-pre18 branch.
3.x-pre18 will work on all OTP releases starting from R16B03 and its beam will recompile itself to accommodate.
For example, this branch is used by RabbitMQ Exporter 3.6.x
that should be compatible with all versions starting from R16B03.
Rebar3 is supported.
Example Console Session
Run shell with compiled and loaded app:
$ rebar3 shell
Start prometheus app:
prometheus:start().
Register metrics:
prometheus_gauge:new([{name, pool_size}, {help, "MongoDB Connections pool size"}]),
prometheus_counter:new([{name, http_requests_total}, {help, "Http request count"}]).
prometheus_summary:new([{name, orders}, {help, "Track orders count/total sum"}]).
prometheus_histogram:new([{name, http_request_duration_milliseconds},
{labels, [method]},
{buckets, [100, 300, 500, 750, 1000]},
{help, "Http Request execution time"}]).
Use metrics:
prometheus_gauge:set(pool_size, 365),
prometheus_counter:inc(http_requests_total).
prometheus_summary:observe(orders, 10).
prometheus_summary:observe(orders, 15).
prometheus_histogram:observe(http_request_duration_milliseconds, [get], 95).
prometheus_histogram:observe(http_request_duration_milliseconds, [get], 100).
prometheus_histogram:observe(http_request_duration_milliseconds, [get], 102).
prometheus_histogram:observe(http_request_duration_milliseconds, [get], 150).
prometheus_histogram:observe(http_request_duration_milliseconds, [get], 250).
prometheus_histogram:observe(http_request_duration_milliseconds, [get], 75).
prometheus_histogram:observe(http_request_duration_milliseconds, [get], 350).
prometheus_histogram:observe(http_request_duration_milliseconds, [get], 550).
prometheus_histogram:observe(http_request_duration_milliseconds, [get], 950).
prometheus_histogram:observe(http_request_duration_milliseconds, [post], 500),
prometheus_histogram:observe(http_request_duration_milliseconds, [post], 150).
prometheus_histogram:observe(http_request_duration_milliseconds, [post], 450).
prometheus_histogram:observe(http_request_duration_milliseconds, [post], 850).
prometheus_histogram:observe(http_request_duration_milliseconds, [post], 750).
prometheus_histogram:observe(http_request_duration_milliseconds, [post], 1650).
Export metrics as text:
io:format(prometheus_text_format:format()).
->
# TYPE http_requests_total counter
# HELP http_requests_total Http request count
http_requests_total 2
# TYPE pool_size gauge
# HELP pool_size MongoDB Connections pool size
pool_size 365
# TYPE orders summary
# HELP orders Track orders count/total sum
orders_count 4
orders_sum 50
# TYPE http_request_duration_milliseconds histogram
# HELP http_request_duration_milliseconds Http Request execution time
http_request_duration_milliseconds_bucket{method="post",le="100"} 0
http_request_duration_milliseconds_bucket{method="post",le="300"} 1
http_request_duration_milliseconds_bucket{method="post",le="500"} 3
http_request_duration_milliseconds_bucket{method="post",le="750"} 4
http_request_duration_milliseconds_bucket{method="post",le="1000"} 5
http_request_duration_milliseconds_bucket{method="post",le="+Inf"} 6
http_request_duration_milliseconds_count{method="post"} 6
http_request_duration_milliseconds_sum{method="post"} 4350
http_request_duration_milliseconds_bucket{method="get",le="100"} 3
http_request_duration_milliseconds_bucket{method="get",le="300"} 6
http_request_duration_milliseconds_bucket{method="get",le="500"} 7
http_request_duration_milliseconds_bucket{method="get",le="750"} 8
http_request_duration_milliseconds_bucket{method="get",le="1000"} 9
http_request_duration_milliseconds_bucket{method="get",le="+Inf"} 9
http_request_duration_milliseconds_count{method="get"} 9
http_request_duration_milliseconds_sum{method="get"} 2622
API
API can be grouped like this:
Standard Metrics & Registry
All metrics created via new/1 or declare/1. The difference is that new/1 actually wants metric to be
new and raises {mf_already_exists, {Registry, Name}, Message} error if it isn't.
Both new/1 and declare/1 accept options as proplist.
Common options are:
- name - metric name, can be an atom or a string (required);
- help - metric help, string (required);
- labels - metric labels, label can be an atom or a string (default is []);
- registry - Prometheus registry for the metric, can be any term. (default is default)
Histogram also accepts buckets option. Please refer to respective modules docs for the more information.
General Helpers
Advanced
You will need these modules only if you're writing a custom collector for an app/lib that can't be instrumented directly.
Build
$ rebar3 compile
Configuration
Prometheus.erl supports standard Erlang app configuration.
collectors - List of custom collectors modules to be registered automatically.
Can be all_loaded in order to find all modules implementing the prometheus_collector behaviour.
Supports an "alias" option default, which will append all default collectors implemented in this library.
If undefined, the default collectors implemented in this library will be used.instrumenters - List of custom instrumenter modules to be registered automatically.
Can be all_loaded in order to find all modules implementing the prometheus_instrumenter behaviour.
If undefined, none will be loaded.default_metrics - List of metrics to be registered during app startup.
Metric format: {Type, Spec} where Type is a metric type (counter, gauge, etc),
Spec is a list to be passed to Metric:declare/1.
Deprecated format {Registry, Metric, Spec} also supported.
Collectors & Exporters Conventions
Configuration
All 3d-party libraries should be configured via prometheus app env.
Exporters are responsible for maintaining scrape endpoint.
Exporters are usually tightly coupled with the web server and are singletons.
They should understand these keys:
path - url for scraping;format - scrape format as module name i.e. prometheus_text_format or prometheus_protobuf_format.
Exporter-specific options should be under <exporter_name>_exporter for erlang or <Exporter_name>Exporter for Elixir i.e. PlugsExporter or elli_exporter
Collectors collect integration specific metrics i.e. ecto timings, process information and so on.
Their configuration should be under <collector_name>_collectorfor erlang or <Collector_name>Collector for Elixir i.e. process_collector, EctoCollector and so on.
Naming
For Erlang: prometheus_<name>_collector/prometheus_<name>_exporter.
For Elixir: Prometheus.<name>Collector/Prometheus.<name>Exporter.