Page not found
Sorry, but the page you were trying to get to, does not exist. You may want to try searching this site using the sidebar or using our API Reference page to find what you were looking for.
Sorry, but the page you were trying to get to, does not exist. You may want to try searching this site using the sidebar or using our API Reference page to find what you were looking for.
This package contains a couple of profiling shell scripts to aid live-system investigation. Among them:
This sampling profiler is intendend for shell and remote shell usage. Most commands here print their results to the screen for human inspection.
Example usage:
iex(2)> Profiler.profile("<0.187.0>")
100% {:proc_lib, :init_p_do_apply, 3, [file: 'proc_lib.erl', line: 249]}
100% {IEx.Evaluator, :init, 4, [file: 'lib/iex/evaluator.ex', line: 27]}
100% {IEx.Evaluator, :loop, 1, [file: 'lib/iex/evaluator.ex', line: 103]}
100% {IEx.Evaluator, :eval, 3, [file: 'lib/iex/evaluator.ex', line: 217]}
100% {IEx.Evaluator, :do_eval, 3, [file: 'lib/iex/evaluator.ex', line: 239]}
100% {IEx.Evaluator, :handle_eval, 5, [file: 'lib/iex/evaluator.ex', line: 258]}
100% {:elixir, :eval_forms, 3, [file: 'src/elixir.erl', line: 263]}
100% {:elixir, :recur_eval, 3, [file: 'src/elixir.erl', line: 278]}
100% {:erl_eval, :do_apply, 6, [file: 'erl_eval.erl', line: 680]}
100% {Profiler, :profile, 2, [file: 'lib/profiler.ex', line: 120]}
100% {Enum, :reduce_range_inc, 4, [file: 'lib/enum.ex', line: 3371]}
100% {Profiler, :"-profile/2-fun-0-", 3, [file: 'lib/profiler.ex', line: 121]}Demo function for the documentation. Never implement fibonacci like this. Never
This runs fprof the given amount of milliseconds or 5 seconds by default.
hotspots returns process names / stacktraces by the amount they are seen in the given the timeout.
Converts a term to a pid. Accepts
print_hotspots lists process names / stacktraces by the amount they are seen in the given the timeout.
Identify the best human readable name for a process. Supports as
arguments all types supported by pid/1
Processes lists all processes ordered by reductions withing the given timeout. For that it takes an initial snapshot, sleeps the given timeout and takes a second snapshot.
Processes lists all processes ordered by heap usage.
Lists the processes by message queue length.
This runs the sampling profiler for the given amount of milliseconds or 10 seconds by default. The sampling profiler will collect stack traces of the given process pid or process name and print the collected samples based on frequency.
Arguments are the same as for profile() but this sampling profiler does not analyze stacktrace but instead just samples the current function and prints the result.
Returns current stacktrace for the given pid and allows setting the erlang internal stacktrace depth.
Times the given function and prints the result. Example usage
In order to identify processes that are supposed to be short-lived but actually take too mich time this function produces Logger.warning() with a stacktrace if the provided process is still alive after the given timeout.
@spec demo_fib(integer()) :: pos_integer()
Demo function for the documentation. Never implement fibonacci like this. Never
@spec fprof(task(), non_neg_integer()) :: binary()
This runs fprof the given amount of milliseconds or 5 seconds by default.
When the run completes the code tries to open kcachegrind to show the resultung kcachegrind file. Ensure to have kcachegrind installed. If kcachgrind is not found the function will just return the name of the generated report file. It can then be copied to another lcoation for analysis
For pid there are five different input formats allowed:
In this example the profiler is used to profile itself. The first percentage number shows how many samples were found in the given function call. Indention indicates the call stack:
iex(1)> Profiler.fprof(fn -> Profiler.demo_fib(30) end)hotspots returns process names / stacktraces by the amount they are seen in the given the timeout.
Converts a term to a pid. Accepts
Examples:
iex(1)> Profiler.pid(1)
<0.1.0>
iex(2)> Profiler.pid("1")
<0.1.0>
iex(3)> Profiler.pid("Elixir.IEx.Evaluator")
<0.187.0>
iex(4)> Profiler.pid({:IEx.Evaluator, :init, 4})print_hotspots lists process names / stacktraces by the amount they are seen in the given the timeout.
Identify the best human readable name for a process. Supports as
arguments all types supported by pid/1
Examples:
iex(1)> Profiler.process_name(1)
:erst_code_purger
iex(2)> Profiler.process_name(self())
{IEx.Evaluator, :init, 5}@spec processes(non_neg_integer() | Keyword.t()) :: :ok
Processes lists all processes ordered by reductions withing the given timeout. For that it takes an initial snapshot, sleeps the given timeout and takes a second snapshot.
The following options are supported:
iex(1)> Profiler.processes
[<0.187.0>,{'Elixir.IEx.Evaluator',init,4},1339]
[<0.132.0>,tls_client_ticket_store,32]
[<0.182.0>,{'Elixir.Logger.Watcher',init,1},1]
[<0.181.0>,'Elixir.Logger.BackendSupervisor',1]
[<0.180.0>,{'Elixir.Logger.Watcher',init,1},1]
[<0.179.0>,'Elixir.Logger',1]
[<0.178.0>,'Elixir.Logger.Supervisor',1]
[<0.177.0>,{application_master,start_it,4},1]
[<0.176.0>,{application_master,init,4},1]
[<0.161.0>,'Elixir.Hex.UpdateChecker',1]
:ok@spec processes_memory() :: :ok
Processes lists all processes ordered by heap usage.
@spec processes_message_queue_len() :: :ok
Lists the processes by message queue length.
@spec profile(task(), non_neg_integer()) :: :ok
This runs the sampling profiler for the given amount of milliseconds or 10 seconds by default. The sampling profiler will collect stack traces of the given process pid or process name and print the collected samples based on frequency.
For pid there are five different input formats allowed:
In this example the profiler is used to profile itself. The first percentage number shows how many samples were found in the given function call. Indention indicates the call stack:
iex(2)> Profiler.profile(187)
100% {:proc_lib, :init_p_do_apply, 3, [file: 'proc_lib.erl', line: 249]}
100% {IEx.Evaluator, :init, 4, [file: 'lib/iex/evaluator.ex', line: 27]}
100% {IEx.Evaluator, :loop, 1, [file: 'lib/iex/evaluator.ex', line: 103]}
100% {IEx.Evaluator, :eval, 3, [file: 'lib/iex/evaluator.ex', line: 217]}
100% {IEx.Evaluator, :do_eval, 3, [file: 'lib/iex/evaluator.ex', line: 239]}
100% {IEx.Evaluator, :handle_eval, 5, [file: 'lib/iex/evaluator.ex', line: 258]}
100% {:elixir, :eval_forms, 3, [file: 'src/elixir.erl', line: 263]}
100% {:elixir, :recur_eval, 3, [file: 'src/elixir.erl', line: 278]}
100% {:erl_eval, :do_apply, 6, [file: 'erl_eval.erl', line: 680]}
100% {Profiler, :profile, 2, [file: 'lib/profiler.ex', line: 120]}
100% {Enum, :reduce_range_inc, 4, [file: 'lib/enum.ex', line: 3371]}
100% {Profiler, :"-profile/2-fun-0-", 3, [file: 'lib/profiler.ex', line: 121]}@spec profile_simple(task(), non_neg_integer()) :: :ok
Arguments are the same as for profile() but this sampling profiler does not analyze stacktrace but instead just samples the current function and prints the result.
The first number shows the total number of samples that have been recorded per function call.
For pid there are five different input formats allowed:
iex(2)> Profiler.profile_simple 197
{10000, {Profiler, :"-profile_simple/2-fun-0-", 3}}Returns current stacktrace for the given pid and allows setting the erlang internal stacktrace depth.
Times the given function and prints the result. Example usage:
iex(1)> Profiler.time(fn() -> Process.sleep 1000 end)
timer: 1004
:ok@spec trace_all_calls(task(), non_neg_integer()) :: binary()
@spec trace_poll_stacktrace(task(), non_neg_integer()) :: binary()
In order to identify processes that are supposed to be short-lived but actually take too mich time this function produces Logger.warning() with a stacktrace if the provided process is still alive after the given timeout.
If the process is just running a certain critical section that should be monitored
the warning can be supressed using cancel_warn_if_stuck()
@pid Pid of the process to be monitored, or a function after which the warning will be autocancelled @opts can be
timeout -> Timeout in ms after which the warning will be produced. defaults to 5_000label -> Process label to be used in the report or just the pid will be usedfun -> When provided this function replaces the default report via Logger.warningThis package contains a couple of profiling shell scripts to aid live-system investigation. Among them
'+((o=e.lambda(l,l))!=null?o:"")+`
`},9:function(e,l,a,p,u){var o,n=e.lookupProperty||function(r,s){if(Object.prototype.hasOwnProperty.call(r,s))return r[s]};return((o=(n(a,"isArray")||l&&n(l,"isArray")||e.hooks.helperMissing).call(l??(e.nullContext||{}),l!=null?n(l,"results"):l,{name:"isArray",hash:{},fn:e.program(10,u,0),inverse:e.program(12,u,0),data:u,loc:{start:{line:23,column:2},end:{line:29,column:14}}}))!=null?o:"")+`The search functionality is full-text based. Here are some tips:
foo bar) are searched as OR* anywhere (such as fo*) as wildcard+ before a word (such as +foo) to make its presence required- before a word (such as -foo) to make its absence required: to search on a particular field (such as field:word). The available fields are title, doc and typeWORD^NUMBER (such as foo^2) to boost the given wordWORD~NUMBER (such as foo~2) to do a search with edit distance on wordTo quickly go to a module, type, or function, use the autocompletion feature in the sidebar search.
`},10:function(e,l,a,p,u){var o,n=e.lookupProperty||function(r,s){if(Object.prototype.hasOwnProperty.call(r,s))return r[s]};return"Sorry, we couldn't find anything for "+e.escapeExpression((o=(o=n(a,"value")||(l!=null?n(l,"value"):l))!=null?o:e.hooks.helperMissing,typeof o=="function"?o.call(l??(e.nullContext||{}),{name:"value",hash:{},data:u,loc:{start:{line:24,column:48},end:{line:24,column:57}}}):o))+`.
`},12:function(e,l,a,p,u){var o,n=e.lookupProperty||function(r,s){if(Object.prototype.hasOwnProperty.call(r,s))return r[s]};return(o=n(a,"if").call(l??(e.nullContext||{}),l!=null?n(l,"value"):l,{name:"if",hash:{},fn:e.program(13,u,0),inverse:e.program(15,u,0),data:u,loc:{start:{line:25,column:2},end:{line:29,column:2}}}))!=null?o:""},13:function(e,l,a,p,u){var o,n=e.lookupProperty||function(r,s){if(Object.prototype.hasOwnProperty.call(r,s))return r[s]};return"Invalid search: "+e.escapeExpression((o=(o=n(a,"errorMessage")||(l!=null?n(l,"errorMessage"):l))!=null?o:e.hooks.helperMissing,typeof o=="function"?o.call(l??(e.nullContext||{}),{name:"errorMessage",hash:{},data:u,loc:{start:{line:26,column:23},end:{line:26,column:39}}}):o))+`.
`},15:function(e,l,a,p,u){return`Please type something into the search bar to perform a search.
`},compiler:[8,">= 4.3.0"],main:function(e,l,a,p,u){var o,n=l??(e.nullContext||{}),r=e.lookupProperty||function(s,i){if(Object.prototype.hasOwnProperty.call(s,i))return s[i]};return`The sampling profiler is a single process profiler to inspect runtime of time consuming processes. This is especially useful for doing performance analysis and optimization.
Please checkout the full documentation at: https://hexdocs.pm/profiler/Profiler.html
Example output for profiling the Diode Blockchain Server:
iex(2)> Profiler.profile(Chain.Worker)
100% {:proc_lib, :init_p_do_apply, 3, [file: 'proc_lib.erl', line: 249]}
100% {:gen_server, :handle_msg, 6, [file: 'gen_server.erl', line: 711]}
100% {:gen_server, :try_dispatch, 4, [file: 'gen_server.erl', line: 637]}
26% {Chain.Worker, :handle_info, 2, [file: 'lib/chain/worker.ex', line: 103]}
26% {Process, :sleep, 1, [file: 'lib/process.ex', line: 253]}
74% {Chain.Worker, :handle_info, 2, [file: 'lib/chain/worker.ex', line: 110]}
74% {Chain.Worker, :do_work, 1, [file: 'lib/chain/worker.ex', line: 122]}
24% {Chain.Block, :sign, 2, [file: 'lib/chain/block.ex', line: 269]}
24% {Chain.Header, :sign, 2, [file: 'lib/chain/header.ex', line: 59]}
24% {Chain.Header, :encode_egg, 1, [file: 'lib/chain/header.ex', line: 31]}
50% {Chain.Block, :sign, 2, [file: 'lib/chain/block.ex', line: 270]}
50% {Chain.Header, :update_hash, 1, [file: 'lib/chain/header.ex', line: 54]}
50% {Chain.Header, :encode_chicken, 1, [file: 'lib/chain/header.ex', line: 43]}
50% {MnesiaMerkleTree, :root_hash, 1, [file: 'lib/mnesiamerkletree.ex', line: 62]}
49% {MnesiaMerkleTree, :update_merkle_hash_count, 1, [file: 'lib/mnesiamerkletree.ex', line: 393]}
49% {:lists, :zipwith, 3, [file: 'lists.erl', line: 451]}
49% {:lists, :zipwith, 3, [file: 'lists.erl', line: 451]}
13% {MnesiaMerkleTree, :signature, 1, [file: 'lib/mnesiamerkletree.ex', line: 460]}
23% {MnesiaMerkleTree, :signature, 1, [file: 'lib/mnesiamerkletree.ex', line: 461]}
23% {BertExt, :encode!, 1, [file: 'lib/bert.ex', line: 43]}
12% {Enum, :"-map/2-lists^map/1-0-", 2, []}
9% {Enum, :map, 2, [file: 'lib/enum.ex', line: 1395]}
:okAlso the profiler has tooling to profile using the erlang native fprof module and will call the external kcachegrind tool when available for visualization.
MacOS: brew install qcachegrind
Ubuntu: sudo apt install kcachegrind
Windows: https://sourceforge.net/projects/qcachegrindwin/files/latest/download
iex(6)> Profiler.fprof(fn -> ExSha3Tiny.sha3_256(str) end)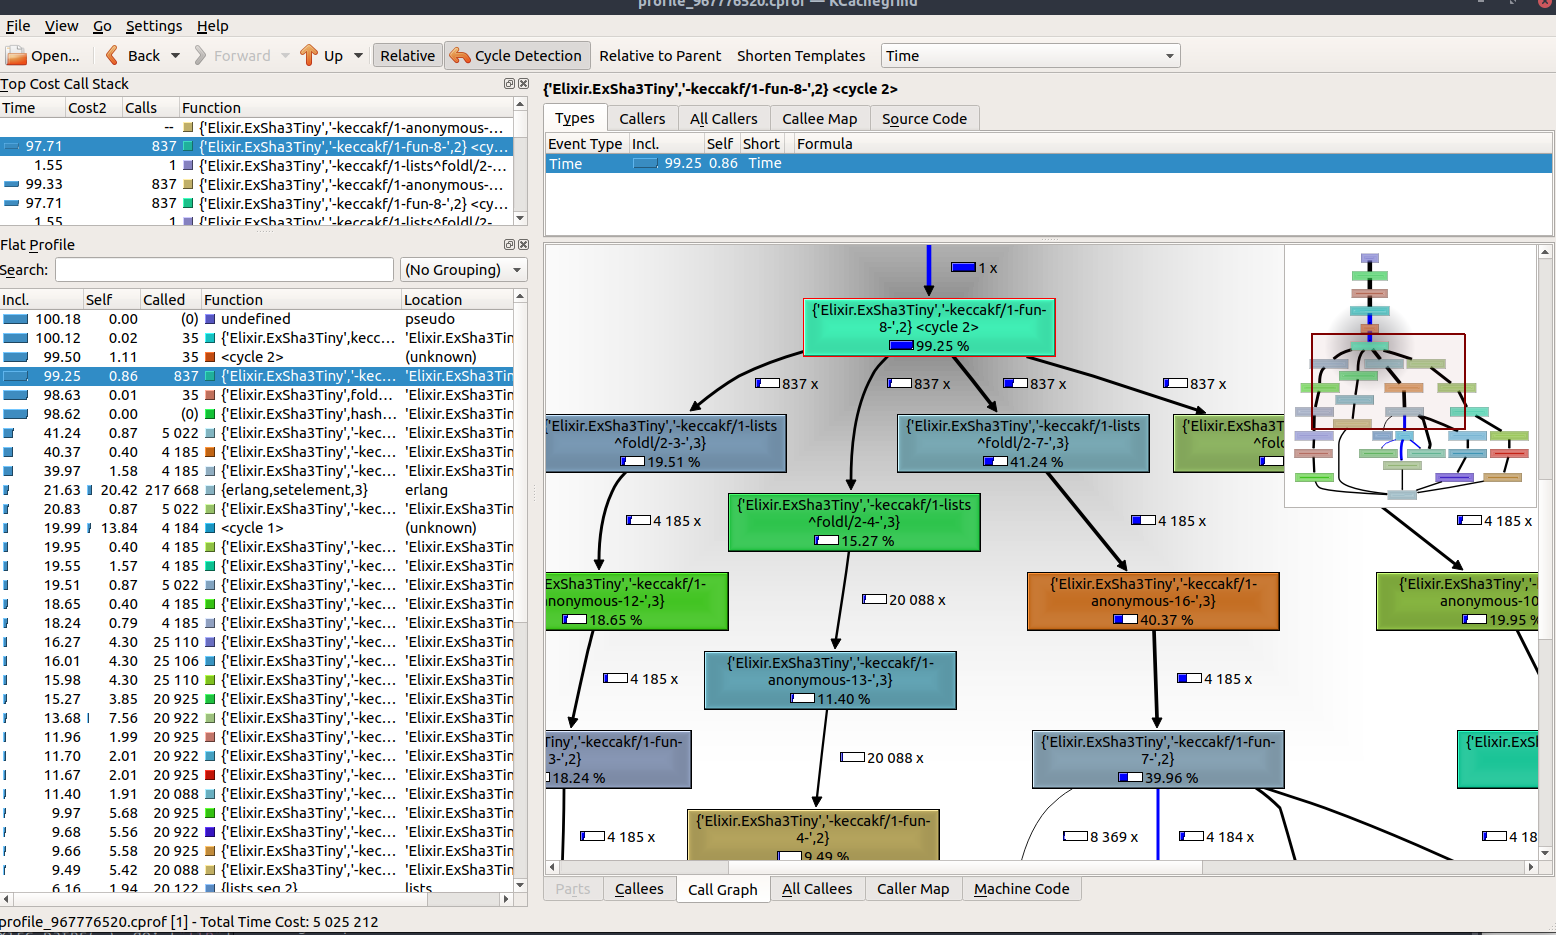
The profiler can be installed by adding profiler to your list of dependencies in mix.exs:
def deps do
[
{:profiler, "~> 0.2"}
]
end